


Have you ever wondered how Netflix is suggesting movies for you or how amazon is recommending products to buy. What exactly is the tech behind and how your own data help them gain more profit repeatedly with your activities.
Diving directly into tech, the system that they are using is recommender. This recommender or filtering system is roughly of types.
- Collaborative filtering : Collaborative filtering methods predict the target user’s rating of a given item using similar users’ ratings of that item .If you are trying to guess whether or not you will like a certain movie, you might ask people with similar taste what they thought of that movie. You also might ask these people what other movies they liked and gather a list of recommendations.
- Content based filtering : Unlike collaborative filtering methods, content-based recommender systems do not use other user’s ratings at all. Instead, they utilize descriptive keywords associated with each item to make recommendations. This is quite useful, because the only rating history we need to make predictions is that of the target user.
Fine of the definition, let’s build a realtime product with available dataset. Now I’ll make a recommender system with Collaborative filtering concept.
Language used : Python
Tool : Anaconda Navigator — Spyder
Packages : Pandas, numpy, seaborn, matplotlib, json.
# Import headers
import numpy as np
import pandas as pd
import matplotlib.pyplot as plt
import seaborn as sns
import json
import flaskapp = flask.Flask(__name__)
app.config[“DEBUG”] = True[@a](twitter.com/app "Twitter profile for @app")pp.route(‘/’, methods=[‘GET’])
def home():# Gather Data
column_names = [‘user_id’, ‘item_id’, ‘rating’, ‘timestamp’]
df = pd.read_csv(‘u.data’, sep=’\t’, names=column_names)
movie_titles = pd.read_csv(“Movie_Id_Titles”)print(df.head())
print(movie_titles.head())# Merging movie data with movie titles based on the item_id
df = pd.merge(df,movie_titles,on=’item_id’)
print(df.head())# Data Visualisation based on rating and count
sns.set_style(‘white’)# high rated movies not based on ppl
print(df.groupby(‘title’)[‘rating’].mean().sort_values(ascending=False).head())#max participation in rating movie
print(df.groupby(‘title’)[‘rating’].count().sort_values(ascending=False).head())ratings = pd.DataFrame(df.groupby(‘title’)[‘rating’].mean())
print(ratings.head())ratings[‘num of ratings’] = pd.DataFrame(df.groupby(‘title’)[‘rating’].count())
print(ratings.head())# distribution of ratings
plt.figure(figsize=(10,4))
ratings[‘num of ratings’].hist(bins=70)# outlier and participation histogram to understand the curve : Contains outliers and the gaussian curve.
# Understanding the curve : 3 is the max chosen and outliers are 1 and 5 . the rough graph simply represents the gaussianplt.figure(figsize=(10,4))
ratings[‘rating’].hist(bins=70)# jointplot for rating and number of ratings with scatter check via the cluster
# on seeing the graph : the participation is higher from in 0 -100 ppl and ratings are 2–4.
sns.jointplot(x=’rating’,y=’num of ratings’,data=ratings,alpha=0.5)# Its high time to recommend movies
# This matrix contains user id and how much they rated the movies, most movies value will be empty, cuz the user may have not watched all movies
moviemat = df.pivot_table(index=’user_id’,columns=’title’,values=’rating’)
print(moviemat.head())# higher participation for rating the movie in higher to lower order
print(ratings.sort_values(‘num of ratings’,ascending=False).head(10))# Will be working with 2 movies initially Star Wars (1977)
starwars_user_ratings = moviemat[‘Star Wars (1977)’]
print(starwars_user_ratings.head())# using correlation between two pandas series to find the similarity
similar_to_starwars = moviemat.corrwith(starwars_user_ratings)# Filtering data : Removing NAN value
corr_starwars = pd.DataFrame(similar_to_starwars, columns=[‘Correlation’])
corr_starwars.dropna(inplace=True)# This list may contain movie with less number of 5* rating,
print(corr_starwars.sort_values(‘Correlation’,ascending=False).head(10))
# Filtering the data by taking count 100+ people participation in the rating event
#Combining the ratings data
corr_starwars = corr_starwars.join(ratings[‘num of ratings’])
print(corr_starwars.head())# filtering based on amt of ratings
print(corr_starwars[corr_starwars[‘num of ratings’]>100].sort_values(‘Correlation’,ascending=False).head())relatedMovies = corr_starwars[corr_starwars[‘num of ratings’]>100].sort_values(‘Correlation’,ascending=False).head()
relatedMovieList = relatedMovies.index.tolist()# convert the list into json and return
relevantMovieJson = json.dumps({‘results’: relatedMovieList})
print(relevantMovieJson)
return relevantMovieJsonapp.run()
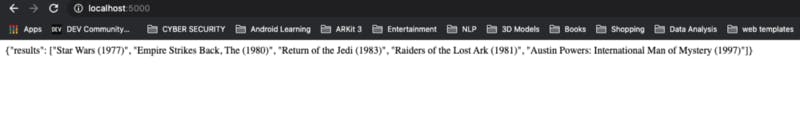
This returns a response Json in localhost:5000 .
The next steps involved is to make an app and connect with the given response.
will be continued in part 2.